¶ Software Features
¶ Analytics
Our analytics section is an extensive, yet easy to navigate, dive into the insights provided to you by our analysis of the data collected from your operations.
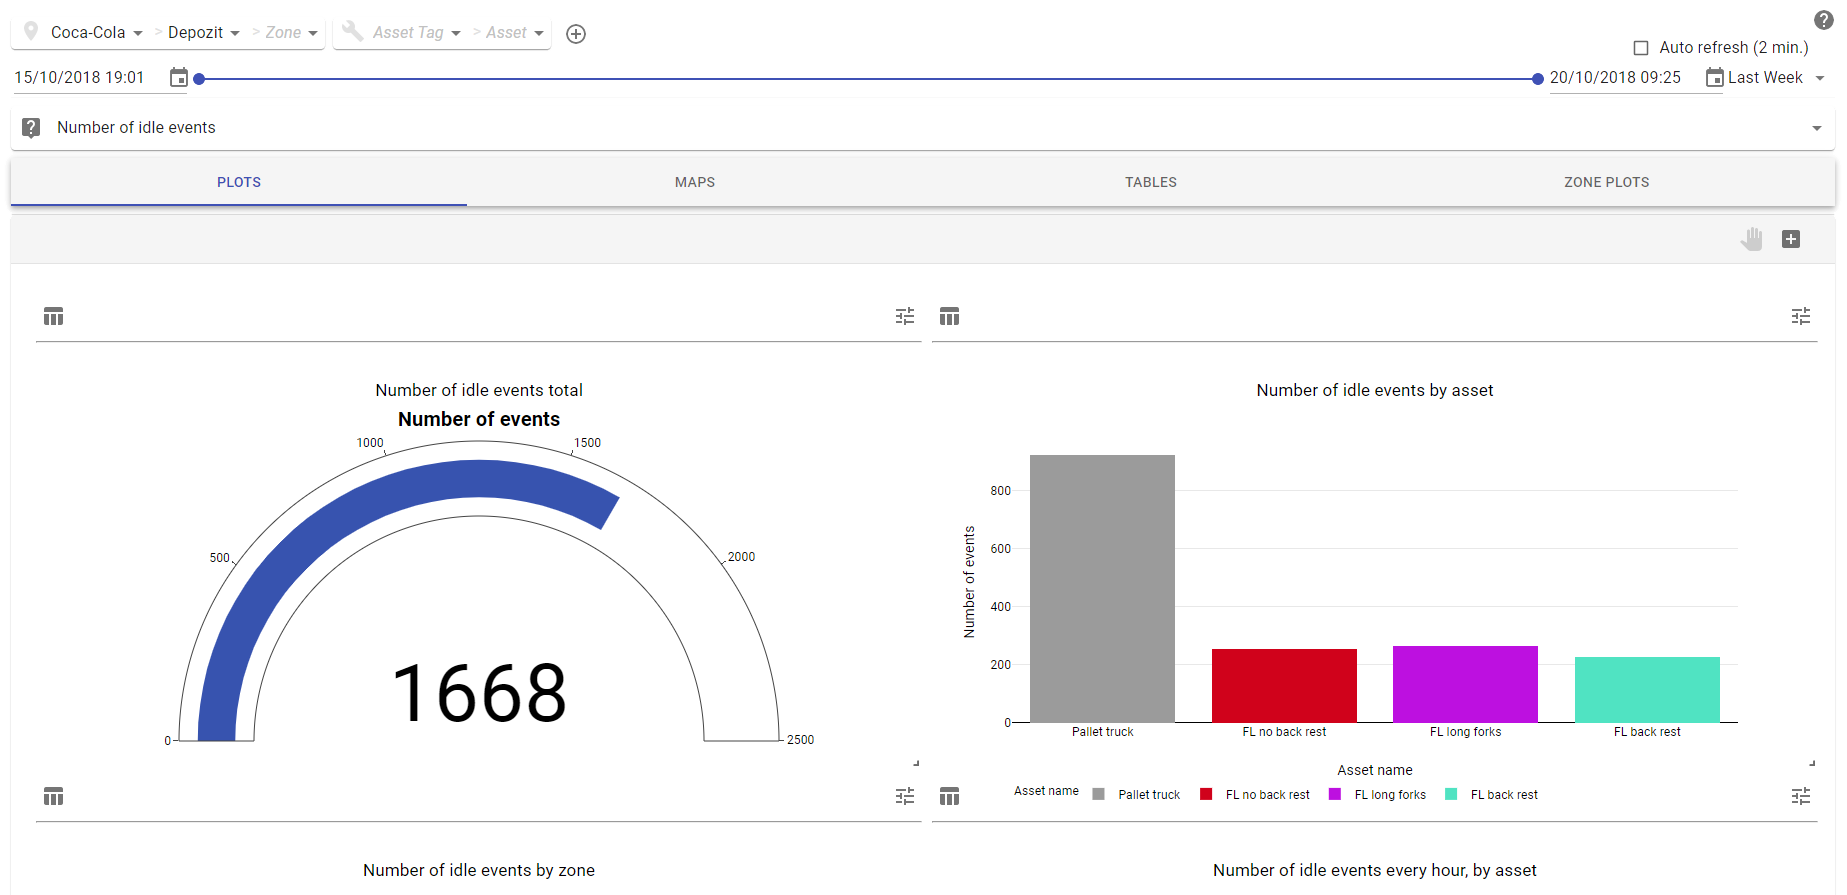
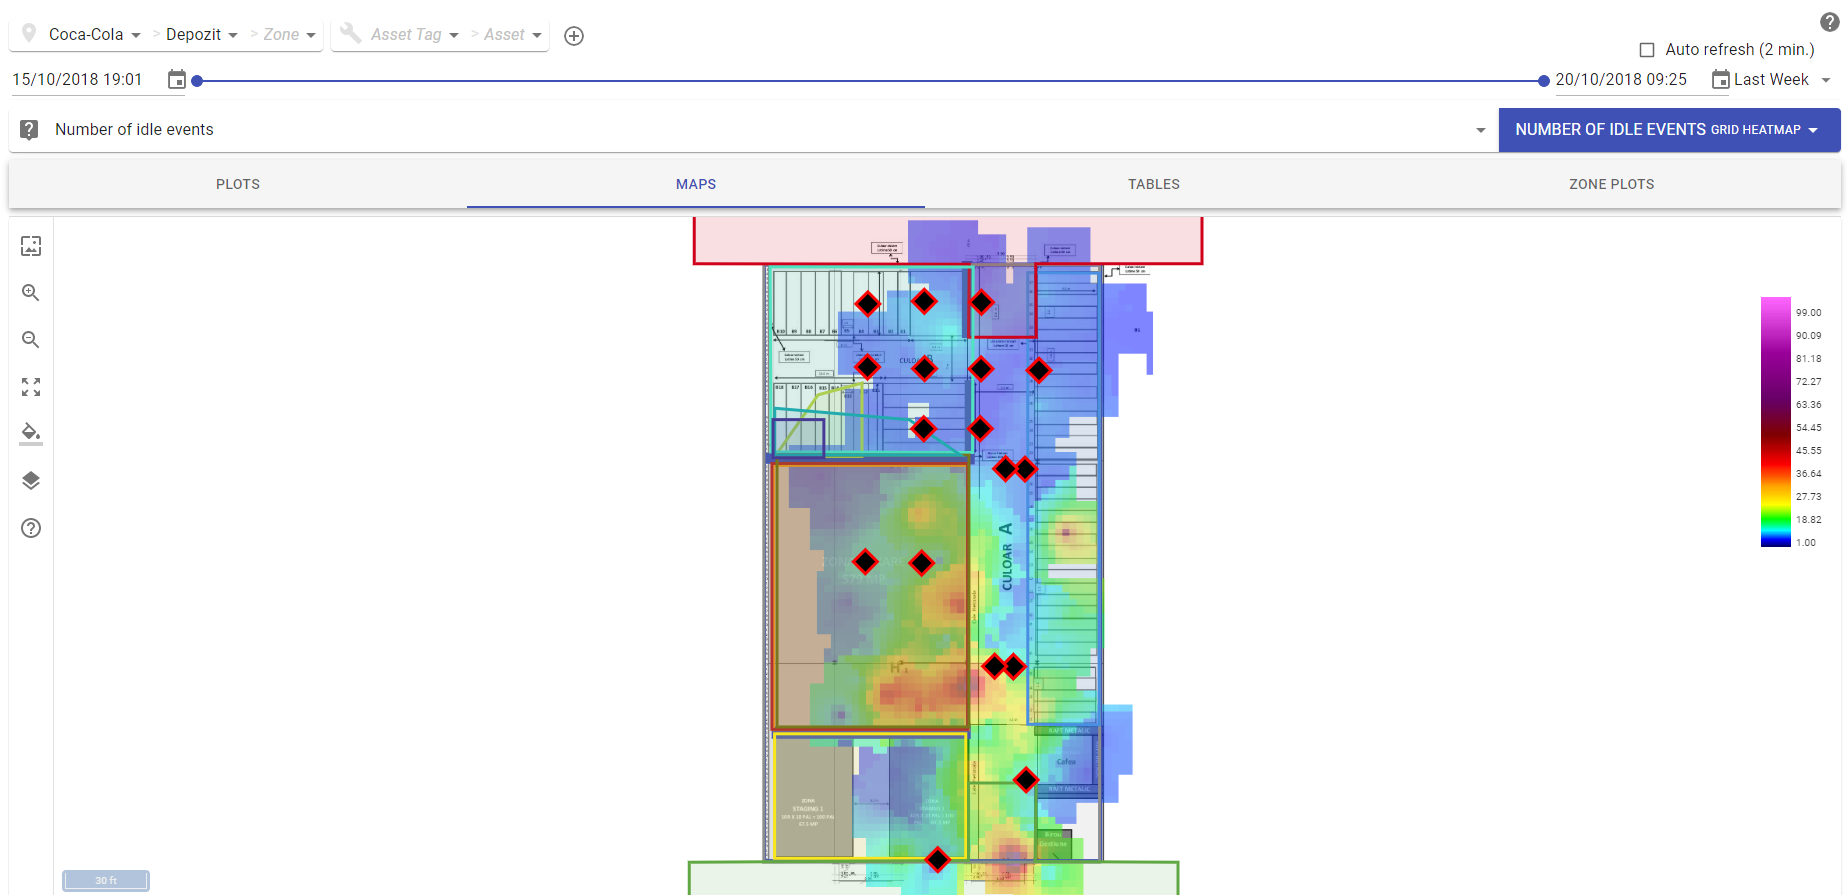
We provide from simple plots to various types of analytic maps like heatmaps, spaghetti maps, scatter maps, and so on. You can filter by periods, warehouses or assets, but also interact with the displayed information, all with the goal of providing actionable insights to your management style.
It's also very easy to export information either in tabular format or xlsx, csv, and a few other commonly used formats.